The Longevity Parameter
Peak VO2 and Prognosis
Cardiorespiratory fitness (CRF) - directly measured as Peak VO2 on CPET - is the single most powerful independent predictor of all-cause mortality in medicine. An evidence base spanning 30 years and more than 20 million observations across 200+ cohort studies establishes a consistent, graded, dose-response relationship between Peak VO2 and outcomes
More importantly, it is modifiable, measurable, and precisely trackable at the individual level - survival of the fittest!
What Peak VO2 Measures
Integrated Performance
Peak VO2 reflects the integrated response of cardiovascular, pulmonary and muscle function
Peak VO2 is the product of peak cardiac output and peripheral O2 extraction. Since peripheral extraction is relatively constant for any given individual, changes in peak VO2 reflect changes in cardiac function - providing a valuable functional window of cardiac performance that resting and imaging tests cannot provide
Why This Matters Clinically
Peak VO2 correlates with mortality more tightly than any individual risk factor because it sits at the distal end of the cardiovascular risk pathway. It measures the cumulative effect of all risk factors - genetics, lipids, hypertension, insulin resistance, obesity, physical inactivity, sleep apnea, stress, smoking and inflammation. Peak VO2 thus integrates cumulative vascular injury from upstream pathways, which is why even small changes carry real prognostic weight. In serial tracking, decreases in Peak VO2 reflect worsening of global cardiovascular function and increases from baseline reflect improving CV function and prognosis
AHA (2016): Adding measured Peak VO2 improves risk classification by 11–43% across all major cohorts
The Prognostic Anchor - What the Data Reveals
Each 1 mL/kg/min increase in Peak VO2 translates to ~5–10% reduction in all-cause mortality
Directly measured by maximal CPET, multivariable adjusted, 30-year follow-up (n=683). Serial measurement: baseline vs post-training. Post-training Peak VO₂ was a significantly stronger mortality predictor than baseline
Imboden et al. Mayo Clin Proc 2019 · Ball State Cohort · Directly measured CPET
Same cohort, same directly measured methodology. Women derive proportionally greater survival benefit per unit of Peak VO₂ improvement. Post-training Peak VO₂ was a significantly stronger mortality predictor than baseline
Imboden et al. Mayo Clin Proc 2019 · Ball State Cohort · Directly measured CPET
Serial CPET - 2nd test 11 years after first: a 1 mL/min·kg higher Peak VO₂ was associated with a 9% relative risk reduction of all-cause mortality in long-term follow up
Laukkanen et al. Mayo Clinic Proceedings, 2016; 91, 1183–1188
Baseline fitness plays an important role in degree of mortality reduction gains per 1 mL/kg/min increase. Highly fit individuals will see reductions at the lower end of the range (~5%) whereas patients with established CVD will see gains closer to 10% and as high as 15%
Disease-specific mortality: Directly measured CPET reveals gradients across cause of death. Imboden et al. (JACC 2018, n=4,137) showed 3.3% all-cause, 4.6% CVD, and 4.0% cancer mortality reduction per mL/kg/min at baseline CRF in a healthy population - confirming the dose-response relationship holds across all major causes of death
Reading the Evidence
Peak VO2, METs, and Outcomes - One Construct
A common point of confusion in reading the CRF-mortality literature is the apparent distinction between studies reporting in METs versus mL/kg/min. There is no physiologic distinction - only a unit conversion
Both describe the same thing: the rate of oxygen consumption relative to body weight
The CRF-mortality relationship is among the most replicated findings in cardiovascular epidemiology. The trajectory from large treadmill-estimated studies to direct CPET measurement strengthens rather than changes the conclusion - it adds individual-level precision to a population-level relationship that was already firmly established
Treadmill-Estimated METs (1980s to 2015)
Large prospective cohort studies estimated CRF from treadmill speed, grade, and exercise duration using validated prediction equations. This approach is well-validated at the population level - establishing the fundamental dose-response relationship across hundreds of thousands of participants. Each 1-MET higher CRF was associated with 12–17% lower all-cause mortality. Kokkinos et al. (JACC 2022, n=750,302 U.S. veterans) confirmed 13–15% lower mortality per MET (~4% per mL/kg/min) across all age groups, BMI categories, races, and sexes
CPET - Direct VO₂ Measurement (2015 - present)
CPET eliminates estimation error by measuring expired gases breath-by-breath, producing a precise Peak VO2 specific to that individual on that day. Directly measured studies now demonstrate the same dose-response relationship at the individual level, with the post-training CPET identified as a stronger mortality predictor than the baseline measurement. This validates the serial tracking framework - the trajectory of change is more informative than any single baseline measurement. CPET additionally provides mechanistic parameters (O2-pulse, VE/VCO2, AT, Inducible Threshold) that are inaccessible from treadmill-time estimation alone
AHA Endorsement
CRF as a Clinical Vital Sign
The 2016 AHA Scientific Statement (Ross et al. Circulation 2016) formally classified cardiorespiratory fitness as a clinical vital sign after synthesizing 13 studies and >130,000 participants showing 12–20% lower mortality per MET (3.4–5.7% per mL/kg/min) across all age groups and sexes. The findings are unambiguous: being unfit carries greater mortality risk than any traditional cardiac risk factor. Compared to the least fit, high fitness men live 6.0 years longer and women live 6.7 years longer (Kokkinos 2022)
No Upper Limit
Elite Fitness: 80% Lower Mortality, No Ceiling
Mandsager 2018 - Graded Mortality Reduction
No J-curve, no “too fit” ceiling, no reverse harm at extreme CRF. Every MET adds prognostic benefit
Together, Kokkinos 2022 and Mandsager 2018 resolve every residual debate: CRF dominates traditional risk factors, applies universally across demographics, and has no upper limit
Precision at the individual level: Population-level dose-response curves do not translate to individual clinical decisions without direct measurement. CPET eliminates the 10–15% estimation error of treadmill testing and provides mechanistic parameters - O2-pulse, Inducible Threshold, VE/VCO2, anaerobic threshold - that identify why Peak VO2 is what it is and what to do about it
Definitions
Peak VO2 vs VO2-max
These terms are frequently used interchangeably with VO₂-max being more common in mainstream media and consumer fitness
- they are not the same
Maximal Oxygen Uptake (VO₂-max)
VO₂-max is defined as a plateau in oxygen uptake (VO₂) despite an incrementally increasing workload at peak exercise (Panel 1). It represents the maximum aerobic work capacity of the muscles to metabolize oxygen. This can only be achieved when there is no cardiovascular or pulmonary limitation.
Peak Oxygen Uptake (Peak VO₂)
The highest VO₂ attained at peak exercise when no plateau is observed. It is the gold standard for quantifying exercise/functional capacity or cardiorespiratory fitness (CRF). Peak VO₂ is what is reported and what all prognostic studies reference.
The distinction between Peak VO₂ and true VO₂-max is crucial: VO₂-max represents the theoretical point at which muscle oxidative capacity is saturated and cannot increase further, even with available oxygen. This true plateau in oxygen uptake is rarely observed in CPET studies (less than 1% of the time, even in athletes). In contrast, Peak VO₂ is the observed maximum oxygen consumption in majority of studies where oxygen consumption (VO₂) rises linearly until peak exercise without reaching a plateau, implying that the limitation is the cardiovascular (CV) system's ability to deliver oxygen. The muscles' oxidative capacity usually far exceeds the CV system's delivery limit, meaning that a higher peak value could be attained if CV delivery were improved and a plateau would eventually be observed
Definitive Precision Study · Directly Measured Peak VO₂ · 24.2 Years Follow-Up
Imboden et al. JACC 2018 - CRF Predicts All Three Major Causes of Death
The Imboden et al. (2018) study (J Am Coll Cardiol 2018;72:2283–92; n=4,137 apparently healthy adults, mean age 42.8 years, mean follow-up 24.2 years - range up to 49 years - 727 deaths) is the definitive study establishing that directly measured CPET-derived Peak VO2 simultaneously predicts all-cause, CVD, and cancer mortality. One of only two cohorts worldwide to use directly measured CRF in an apparently healthy, wide age- and sex-range population
Per 1 mL/kg/min - Three Mortality Endpoints
| Mortality Endpoint | HR per mL/kg/min | % Reduction/mL/kg/min | % Reduction/MET |
|---|---|---|---|
| All-cause | 0.967 | 3.3% | 11.6% |
| Cardiovascular | 0.954 | 4.6% | 16.1% |
| Cancer | 0.960 | 4.0% | 14.0% |
Multivariable adjusted. Directly measured Peak VO₂ by maximal CPET with gas-exchange analysis
Low-Fit vs High-Fit - Absolute Risk Gap
| Endpoint | HR (low vs high fit) | Interpretation |
|---|---|---|
| All-cause mortality | 1.73 | 73% higher risk |
| CVD mortality | 2.27 | >2-fold higher risk |
| Cancer mortality | 2.07 | >2-fold higher risk |
Low vs high fit defined by FRIEND Registry age- and sex-specific percentiles. Multivariable adjusted
This is the strongest published evidence that directly measured Peak VO2 accurately captures the full prognostic signal with precision that estimation cannot match
Kunutsor 2024 GeroScience Review · Imboden 2018 JACC · Franklin 2023
CRF and Cancer: Fitness Protects the Heart and Against Cancer
The cancer-protective effect of CRF is now established across multiple large cohorts. The biological mechanisms overlap substantially with the CVD pathway - the same risk-factor cascade that impairs endothelial function and reduces Peak VO2 also creates a pro-inflammatory, pro-oxidative, insulin-resistant milieu that promotes carcinogenesis. The effect size is substantial: approximately 14% lower cancer mortality per 1-MET improvement, with consistent protection across lung, colorectal, and breast cancer - and a unique 4-fold risk difference between low-fit and high-fit women
Site-Specific Evidence - Kunutsor et al. GeroScience 2024
The 2024 state-of-the-art review (Kunutsor et al. GeroScience 2024;46:5559–5585) synthesizes the observational evidence base. A general threshold of >7 METs (24.5 mL/kg/min) is consistently associated with lower risk across multiple cancer types, with no modification by age, sex, race, or adiposity - the protective effect is universal
| Cancer Type | Evidence | Representative Finding |
|---|---|---|
| Lung | Strong | Meta-analysis (10 cohorts): HR 0.52 highest vs lowest; Lakoski 2015: HR 0.45 |
| Colorectal | Strong | n=177,709 Swedish men: HR 0.63 high vs very-low CRF; meta HR 0.77 |
| Breast | Strong | ETHOS n=44,463: HR 0.82/0.69/0.60 (low/fit/very-fit); consistent across races |
| Bladder | Consistent | HR 0.40 high vs low (Robsahm); HR 0.90 linear (Swedish conscripts) |
| Pancreatic | Suggestive | HR 0.32 high vs low (healthy Norwegian men) |
| Overall cancer incidence/mortality | Strong | HRs 0.73–0.86 high vs low; ~14% cancer mortality reduction per MET |
Franklin 2023 (Henry Ford cohort): CRF ≥12 METs → 61% lower colon and 77% lower lung cancer risk vs <6 METs.
Cancer survivors: highest-CRF group had 45% lower cancer mortality
Why CRF Predicts Cancer as Well as CVD
CRF captures systemic physiology - microvascular health, immune function, insulin signaling, inflammatory tone, hormonal balance. The same risk-factor pathway that drives reduced nitric oxide bioavailability and endothelial dysfunction also creates a pro-carcinogenic milieu through: chronic inflammation (↑IL-6, TNF-α); impaired NK-cell and T-cell surveillance; hyperinsulinemia (↑IGF-1 proliferative drive); adiposity (↑leptin, ↓adiponectin); and impaired DNA repair. Peak VO2 indexes whole-body biological resilience across both organ systems simultaneously
Lifespan and Healthspan
Peak VO₂ Reflects Whole Body Microcirculatory Function
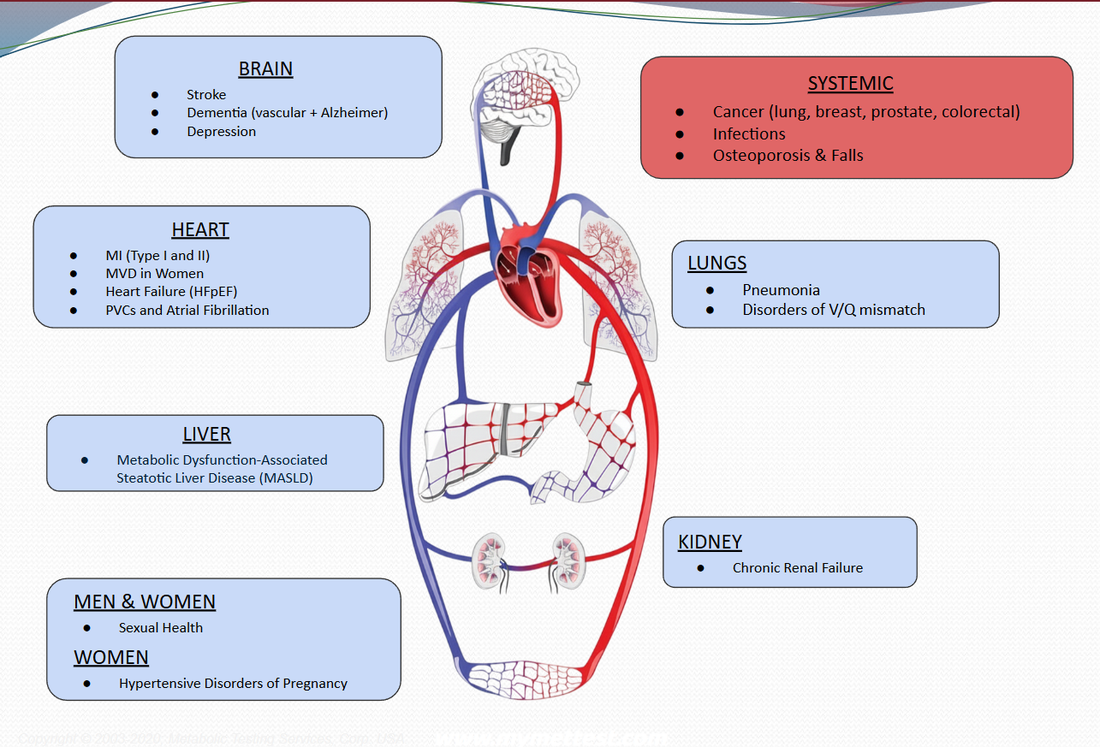
In addition to CV Disease and Cancer, CRF has also demonstrated a linear, dose-response relationship to a number of other conditions including brain health (mood disorders, dementia, executive functioning), infections (including mortality from pneumonia & COVID), bone health, liver and kidney function, sexual health - erectile dysfunction and pregnancy complications. All organs function better when Peak VO₂ is higher - superior Healthspan
Clinical Methodology
Serial CPET: The Patient as Their Own Control
A single CPET tells you where a patient is. Serial CPET tells you where they are going - and whether therapy is working. Kokkinos 2023 (n=93,060), Imboden 2019 (directly measured), and Griffin 2024 (n=91,140) independently confirm: the second CRF measurement is a stronger mortality predictor than the first, and the trajectory matters more than any snapshot
Clinical Exemplar: 17-Year Longitudinal Arc
Published in Mayo Clin Proc 2010 (Chaudhry, Arena, Hansen et al.) and extended across five directly measured serial CPETs over 17 years, this remains the most complete published demonstration of CPET tracking the full arc of ischemic heart disease from subclinical detection through pharmacologic reversal and sustained improvement
| Test | Age | Peak VO₂ (% pred) | Key Event |
|---|---|---|---|
| 1 | 36 | 70% | IT detected; stress ECG normal; diet-only Rx |
| 2 | 37 | 66% | IT progressed; pharmacotherapy initiated |
| 3 | 40 | 80% | IT reversed; O₂-pulse normalized; no lifestyle change |
| 4 | ~44 | 100% | Exercise added; near-complete normalization |
| 5 | 53 | 123% | Continued improvement; above-average for age |
Asymptomatic male, South Asian ancestry, strong family history of premature CAD, substantial dyslipidemia. Normal stress ECG on all published tests - subclinical dysfunction detectable only by CPET physiologic analysis
The nadir-to-peak VO2 recovery (66% → 123% predicted) across 17 years represents a 57-percentage-point improvement - documented step by step on directly measured serial CPET, moving this patient from high-risk toward the lowest-risk category
This individual is healthier and physiologically younger at 53 than he was at age 37. Awareness drives behaviour change that drives better outcomes
Griffin et al. EJPC 2024 - Hospital Admissions Prevented
n=91,140 adults (41.5% women); submaximal cycle ergometry; 3.2-yr between tests; 7-yr follow-up
- Maintaining CRF: 9% fewer CVD admissions, 7% fewer all-cause
- Increasing CRF: 13% fewer CVD admissions, 11% fewer all-cause
- Prior-admission subgroup: increasing CRF → 20% fewer CVD admissions
- Population prevented fraction: ~10,800 CVD admissions / ~61,100 all-cause/yr · EUR 84M (CVD) · EUR 400M (all-cause) annually (Sweden)
Economic Dimension · Franklin 2023 · Griffin 2024
CRF and Healthcare Cost
The prognostic relationship between Peak VO2 and mortality extends directly into healthcare economics. Three independent datasets now quantify the cost impact: U.S. Medicare-linked data (per-MET individual cost reduction), Veterans exercise testing (per-quintile cost differential), and a Swedish population cohort (hospital admission prevented fractions)
Veterans Exercise Testing database (Franklin et al. Mayo Clin Proc 2023). 5.6% lower healthcare cost per MET. Top quintile fitness vs bottom quintile: ~$14,662 lower annual costs per person
Men with high CRF in midlife cost Medicare approximately 40% less than low-CRF patients later in life. Each 1-MET increment → 6.8% (men) and 6.7% (women) decrease in average annual healthcare costs
Griffin et al. EJPC 2024 (n=91,140): maintaining or increasing CRF would avoid ~61,100 all-cause admissions and ~10,800 CVD admissions annually, saving EUR 84M (CVD) and EUR 400M (all-cause) in direct healthcare costs
Percent Predicted Values offer Superior Clinical Utility
Predicted Peak VO2 Equations
Reference equations shape three downstream decisions: interpretation, test design, and serial comparison Percent-predicted Peak VO2 drives impairment classification that carries prognostic weight
CPET-Insight Uses the Hansen-Wasserman Equation
- External validation in modern cohorts: Although derived from a small 1984 cohort, the Hansen-Wasserman equation aligns closely with the large, randomly sampled SHIP cohort of more than 1,200 healthy adults. Its agreement with SHIP is stronger than competing reference equations, supporting its use against contemporary population data
- Body-size calibrated for clinical practice: The Hansen-Wasserman equation uses ideal weight plus a defined oxygen cost for excess body mass, helping keep predicted Peak VO2 stable across the body sizes commonly seen in clinical practice. This is especially important in overweight and obese patients, where actual-weight-only equations can over-predict expected exercise capacity
- Stronger mortality discrimination in head-to-head testing: In a 2024 comparison, the Wasserman equation showed the highest discrimination for all-cause mortality (AUC 0.812), outperforming FRIEND (0.796) and Brazilian (0.753) equations
- Clinically familiar and literature-aligned: The Hansen-Wasserman equation remains one of the most widely used Peak VO2 references in clinical CPET and is familiar to clinicians trained on ATS/ACCP standards. Using it keeps CPET-Insight reports aligned with much of the published CPET literature and easier for referring physicians to interpret
Reference Summary
Key Studies: Effect Sizes and Measurement Methods
Effect sizes vary with study design, population, sex, and measurement precision. The table below shows each study's reported figures alongside its measurement approach
| Study | n | Method | Effect Size (per unit improvement) | Population |
|---|---|---|---|---|
Imboden et al. J Am Coll Cardiol 2018 | 4,137 | Direct CPET | All-cause: 3.3%/mL/kg/min (11.6%/MET) · CVD: 4.6%/mL/kg/min · Cancer: 4.0%/mL/kg/min Low vs high fit: HR 1.73/2.27/2.07 · Women cancer HR 3.94 Predicted VO₂: p=0.06 (NS); direct: p<0.0001 | Healthy adults, 24.2-yr follow-up |
Imboden et al. Mayo Clin Proc 2019 | 683 | Direct CPET | Men: ~6% · Women: ~11% lower mortality per mL/kg/min → 5–10% summary range Serial directly measured CPET; post-training Peak VO₂ stronger predictor (P=0.02); 30-yr follow-up | Healthy adults |
Kavanagh et al. Circulation 2002 | 12,169 | Direct CPET | HR 0.91/mL/kg/min (9% per mL/kg/min); >22 vs <15: cardiac death HR 0.39 2.6-yr survival advantage per mL/kg/min; 55% misclassified by predicted VO₂ | Post-MI/CABG/IHD men, 107,698 man-years |
Kavanagh et al. JACC 2003 | 2,380 | Direct CPET | HR 0.90/mL/kg/min; ≥13 mL/kg/min vs <13: cardiac death HR 0.50 Independent of age 30–80; lower threshold in women vs men | Post-CVD women |
Ezzatvar et al. J Sport Health Sci 2021 | 159,352 | Mixed | High vs low CRF: all-cause HR 0.42, CVD HR 0.27 Per MET all-cause: HR 0.81 (−19%); 21 cohorts | CVD patients, meta-analysis |
Kokkinos et al. JACC 2022 | 750,302 | Estimated METs | 13–15%/MET (~4%/mL/kg/min); least-fit HR 4.09 > all traditional risk factors ≥14 METs: men +6.0 yrs, women +6.7 yrs median survival | Veterans (all ages, races, sexes) |
Mandsager et al. JAMA Netw Open 2018 | 122,007 | Estimated METs | Elite vs Low: HR 0.20 - 80% lower mortality; no upper limit CRF risk exceeds smoking, DM, HTN, CAD; 1.1M person-years | Cleveland Clinic ETT patients |
Kokkinos et al. JACC 2023 | 93,060 | Estimated METs | Serial change ≥2 METs: HR 0.57–0.68; >2-MET decline: HR 1.27–1.77 Dose-response at all fitness levels, ± CVD; serial testing | Veterans ± CVD, serial testing |
Griffin et al. Eur J Prev Cardiol 2024 | 91,140 | Estimated METs | Increasing CRF: 13% fewer CVD admissions (HR 0.87); maintaining: 9% fewer Prior-admission subgroup: 20% fewer CVD admissions · EUR 400M/yr savings | Swedish adults, serial testing |
Radford et al. Circulation 2018 | 8,425 | Estimated METs | HR 0.89/MET at any CAC level - 11% lower CVD risk per MET regardless of plaque burden CAC ≥400 risk halved at high vs low fitness; n=383 CVD events | Men without baseline CVD; 8.4-yr follow-up |
Ross et al. (AHA Statement) Circulation 2016 | >130,000 | Estimated METs | 12–20%/MET = 3.4–5.7%/mL/kg/min (13-study meta-analysis) | Mixed; predominantly healthy |
HF-ACTION (O'Connor et al.) Circ Heart Fail 2012 | 2,331 | Direct CPET | Each 6% relative ↑ in Peak VO2 → 7% lower all-cause mortality (directly measured CPET in heart failure) | Systolic HF (NYHA II–IV) |
Why effect sizes differ: Cross-sectional studies (highest vs lowest fitness at one time point) consistently yield smaller hazard ratios than serial change studies (comparing a person's fitness at two time points) - because improvement captures the full biological benefit of reversing dysfunction. Directly measured CPET yields 8–10× larger parameter estimates than predicted VO2 (Imboden 2018). Both patterns reflect biology, not inconsistency
Ready to Make Directly Measured Peak VO₂ a Clinical Standard?
CPET-Insight provides the infrastructure, clinician-authored logic, and longitudinal reporting framework to bring precisely measured Peak VO₂ to any clinical program - at scale