Clinical Focus Area
Coronary Physiology & Ischemic Heart Disease
CPET-Insight delivers the only commercially available CPET interpretation service built on a peer-reviewed methodology for coronary artery disease assessment developed by Dr. Sundeep Chaudhry. Across four foundational publications (2009–2023) and validated by 30 independent clinical studies, this framework identifies stress-induced mechanical dysfunction - the Inducible Threshold (IT) - at the earliest stage of ischemic heart disease, before symptoms appear and before imaging studies turn abnormal.
It is a precise CV risk assessment with simultaneous ischemia and functional capacity assessment
The Role of CPET in Heart Disease is to Preserve the Coronary Microcirculation (Pre-Imaging)
Coronary Vascular Health = Total Body Vascular Health
The New Role
CPET at the Center of Cardiovascular Care
CPET is the only single test that integrates objective fitness measurement, mechanical dysfunction detection, individualized exercise prescription, and serial tracking into one physiologic assessment
A Cardiovascular Prevention Framework
Early detection of physiological impairment at the reversal stage - before symptoms, before imaging changes, and before structural remodeling
01
Functional Capacity as a Vital Sign
Cardiorespiratory fitness (CRF) is recognized by the AHA as a clinical vital sign (Ross et al., Circulation 2016) - the fourth-leading CVD risk factor, with each 1 mL/kg/min higher Peak VO2 associated with approximately 5–10% lower all-cause mortality. Peak VO2 reflects the net effect of genetics, lifestyle and modifiable cardiometabolic risk factors. Directly measured by CPET, it warrants routine serial assessment to track an individual’s cardiovascular trajectory
02
Risk Stratification and Revascularization
CPET before elective procedures and revascularization provides objective functional and ischemic data to guide clinical thresholds. The O2-pulse plateau identifies patients most likely to derive symptomatic benefit from PCI (ORBITA evidence). A clearly negative CPET (Peak VO2 >91% predicted + no IT) has high negative predictive value and argues strongly against ischemic heart disease. Post-revascularization CPET predicts MACE with a C-statistic of 0.92 (Niu et al. 2020)
03
Individualized Exercise Prescription
The only modality that generates a precise, data-driven exercise prescription. Zone 2 is anchored at the heart-rate at the IT (HR@IT) - the intensity that maximally pressures the cardiovascular system to improve microcirculation while keeping LV end-diastolic pressure from rising. Exercise past the IT drives the myocardium toward progressive ischemia with diminishing returns. This individualized targeting is not possible from stress ECG, echocardiography, or nuclear imaging
04
Serial Therapy Monitoring
Serial CPET documents response to revascularization, cardiac rehabilitation, and pharmacologic optimization. With the patient as their own control, key endpoints include: IT resolution (primary endpoint), rising Peak O2-pulse (stroke volume improvement), rising Peak VO2 (integrated outcome), and resolution of ST changes (electrical signal reversal). Typical reassessment interval: 12 months. The first test is only the baseline - the subsequent tests establish a healthcare trajectory
The sections that follow detail the diagnostic framework, evidence base, and clinical signatures behind each capability
The Diagnostic Framework - By Dr. Sundeep Chaudhry
The Ischemic Cascade
Four foundational papers that helped define the role of CPET in detecting inducible ischemia
Inducible Threshold (IT)
First paper describing CPET for IHD in a major US cardiology journal. The concept of the IT (O2-pulse plateau + HR acceleration +/- ΔVO2/ΔWR flattening) occurring simultaneously after the anaerobic threshold (AT) - CPET detects mechanical dysfunction prior to onset of electrical changes on ECG
Chaudhry S, Arena R, Wasserman K, et al. Am J Cardiol 2009;103:615–619
Individual reversibility
First longitudinal demonstration: subclinical cardiac dysfunction detected in an asymptomatic 36-year-old via the IT, progressed untreated over one year (Peak VO2 70% → 66% predicted), then reversed with lipid-lowering therapy alone over 3.3 years (Peak VO2 → 80% predicted). Proof that CPET tracks disease trajectory at the individual level
Chaudhry S, Arena RA, Hansen JE, et al. Mayo Clin Proc 2010;85:928–932
ΔHR-WR Slope Validation
Prospective validation of new parameter quantifying degree of HR change after the IT (ΔHR-WR slope) in 208 symptomatic patients with coronary angiogram gold standard. Sensitivity increased from 60% to 94% (men) over stress ECG alone. Correctly reclassified abnormal tests by ~4-fold. No difference between obstructive and non-obstructive CAD consistent with microvascular dysfunction (MVD) as underlying pathology
Chaudhry S, Kumar N, Behbahani H, et al. Int J Cardiol 2017;228:114–121
IHD spectrum model
State-of-the-Art Review compiled 30 clinical studies spanning 2003–2022 into the most comprehensive published evidence base for CPET in coronary artery disease. Introduced the four-stage IHD spectrum framework
Chaudhry S, Kumar N, Arena R, Verma S. Curr Opin Cardiol 2023;38
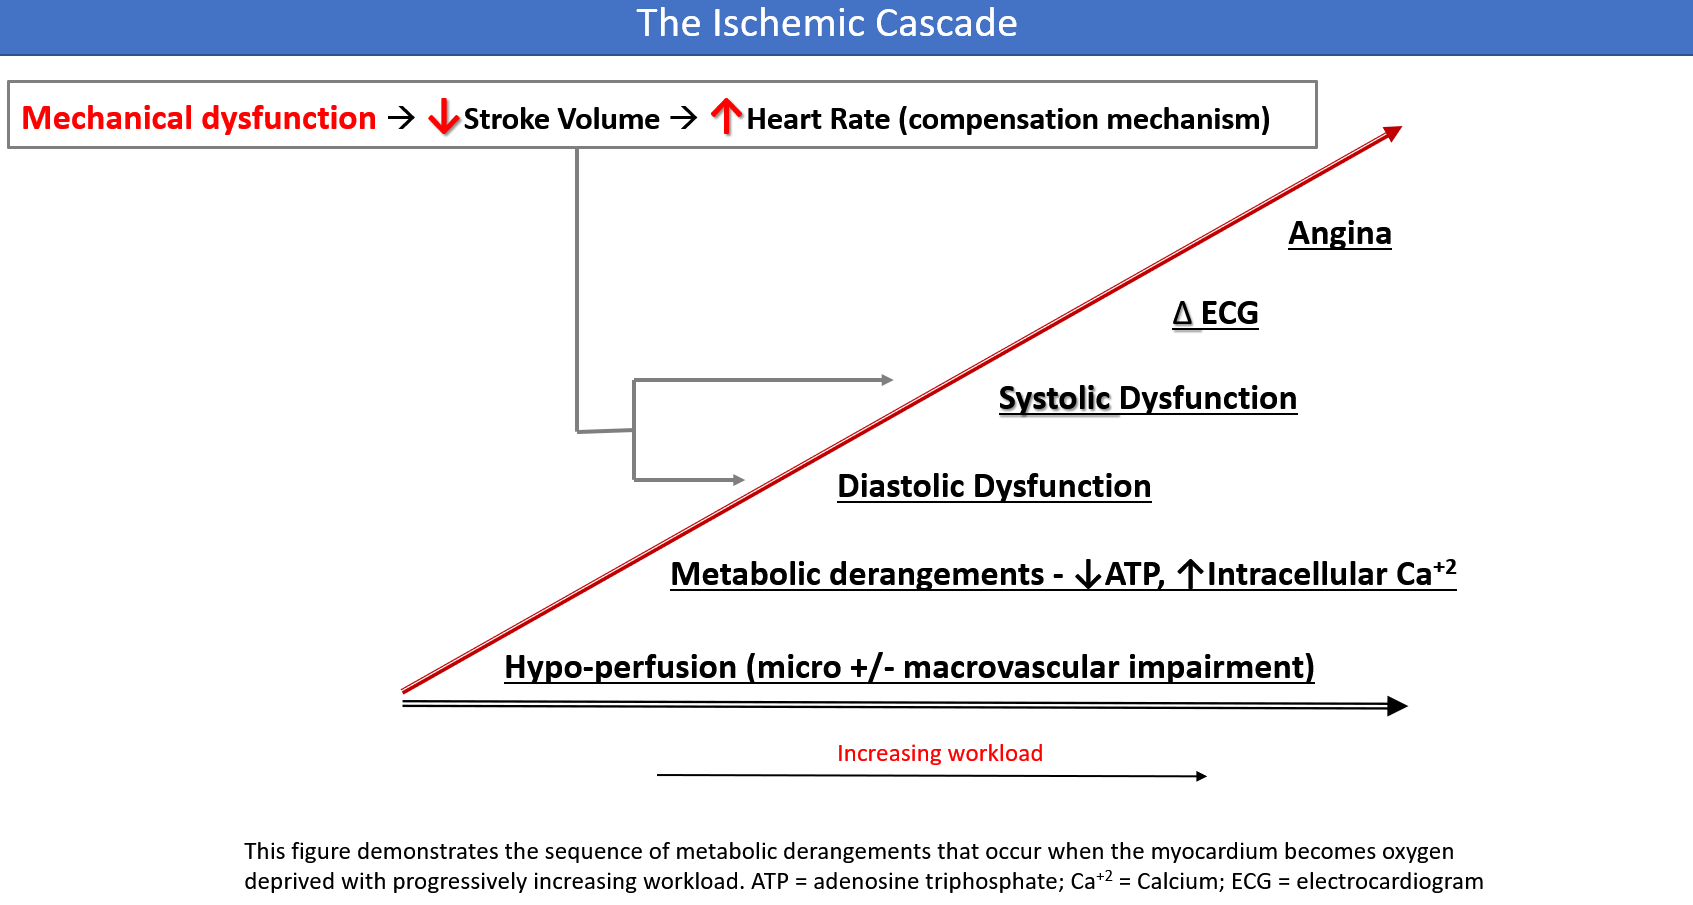 (IT)
(IT)Ischemic cascade simplified
Coronary flow reserve is exceeded
Stroke volume stops rising
Heart rate compensates
ECG may still be normal
Imaging may still be unrevealing
Diagnostic Parameters
Defining Normal Physiology and Cardiac Dysfunction
Stage 2 - Subclinical Dysfunction
Stage 1 - Ideal Cardiac Function
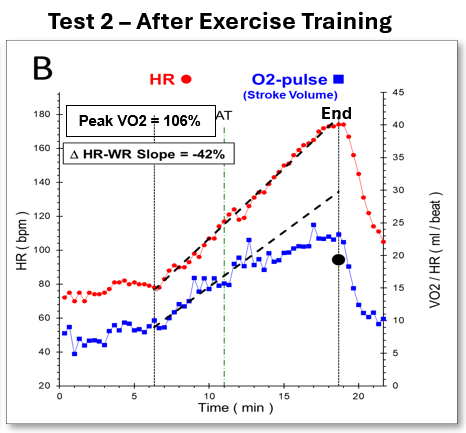
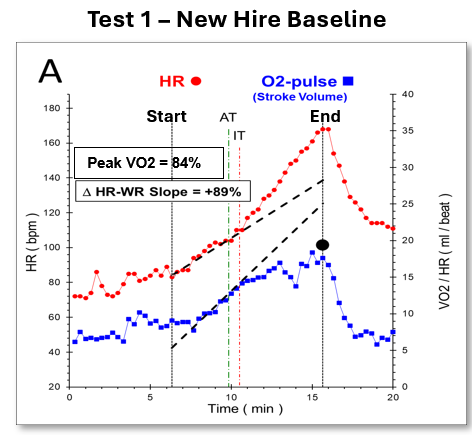
Longitudinal Tracking - Cardiac Function Before and After Exercise Training in a 25-year-old, obese firefighter (new hire):
An asymptomatic new hire acting as his own control before (A) and after (B) completing a two-month exercise training program as part of his work requirement, transitioning from an abnormal (with IT) to normal (no IT) cardiac function pattern. The most prominent findings after the intervention are a subtle change in the O2-pulse trajectory with gradual plateau to a much higher peak value in Test 2, as well as complete normalization of the HR-WR slope after the AT. Peak watts increased by 30%, Peak VO2 by 27%, Peak O2-pulse by 23%, and peak HR by 2% without a change in BMI (40 kg/m2). The change in the O2-pulse trajectory is completely driven by improved stroke-volume dynamics, as he achieves a higher Peak VO2 at similar peak HR. The improvement in cardiac dysfunction is consistent at least in part with reversal of obesity-related endothelial dysfunction, which responds to exercise training. The measured Peak VO2 increased by 6.5 mL/kg/min. This case demonstrates that CV risk can be reduced without a change in BMI (Chaudhry et al., Curr Opin Cardiol 2023)
Prognostic Parameters
When an IT is present from atherosclerosis, the following parameters are a reflection of accumulated global ischemic burden and will deteriorate as coronary artery disease progresses
- 1Peak VO2
Strong, graded inverse relationship with mortality risk. Each 1 mL/kg/min improvement is associated with about 5% lower all-cause mortality in serial population data, with roughly 10-15% lower mortality in established CVD
- 2Peak O2-pulse
Non-invasive stroke-volume surrogate with independent prognostic value. Each 1 mL/beat higher peak O2-pulse is associated with ~8% lower coronary heart disease risk
- 3Anaerobic Threshold (AT)
Effort-independent submaximal marker of global CV function. AT-level VO2 predicts long-term cardiovascular and all-cause mortality, while serial improvement confirms true physiologic adaptation rather than simply harder peak effort
- 4VE vs. VCO2 slope
Effort-independent marker of ventilatory efficiency and V/Q matching. Values above the individual upper limit of predicted normal indicate impaired cardiac function; >36 is a high-impact pre-HF prognostic signal, while >45 suggests severe pulmonary vascular or V/Q mismatch physiology
Together, the diagnostic and prognostic parameters produce a mechanistic profile that informs revascularization decisions, cardiac rehabilitation enrollment, pharmacologic optimization, and long-term risk stratification
Ischemic Heart Disease as a Spectrum
Cardiovascular Risk Stratification - The Disease Continuum
Low Risk
- Peak VO2 ≥ 90% and
- No cardiac dysfunction (IT)
Increased Risk
(mild)
- Peak VO2 ≥ 90%
- Cardiac dysfunction (IT)
Increased Risk
(moderate)
- Peak VO2 = 70–89%
- Cardiac dysfunction (IT)
High Risk
- Peak VO2 < 70%
- Low Peak O2-pulse (SV) ± IT
Peak VO2 and O2-pulse decline
Optimal Cardiovascular Health
- Peak VO2 >90% predicted
- Normal Peak O2-pulse (SV) with linear response
- No heart rate acceleration
(ΔHR-WR slope <15%) - No IT
- Normal Stress ECG
Target state and serial tracking benchmark
Asymptomatic Stage - Detectable Only by CPET
- Peak VO2 >90% predicted
- O2-pulse: early flattening after the AT
- ΔHR-WR slope >+15% (compensatory)
- IT present, symptoms absent
- Abnormal Stress ECG confirms MVD
- Imaging studies normal
The critical prevention window
Symptoms + CV Events
- Peak VO2 <90% predicted
- Reduced peak O2-pulse
- Prominent IT
- ST depression +/- PVCs
- Exertional chest pain, dyspnea, palpitations or fatigue
Standard workup becomes abnormal; CPET provides mechanism and prognosis
End-Stage Disease
- Peak VO2 <70% predicted (often <50%)
- Significantly reduced peak O2-pulse
- VE/VCO2 slope >35
- ΔVO2/ΔWR <8.5 mL/min/W, in more severe cases
- Used for transplant listing and therapy response
CPET is the medical gold standard for determining severity of disease and predicting mortality
The Critical Insight - Stage 2
Based on real-world experience, the majority of the asymptomatic population age 40 and older (~70%) sits in Stage 2 - driven by endothelial dysfunction from one or more cardiovascular risk factors. Exercise physiology is typically the only abnormality at this stage. The IT is the earliest measurable cardiac-mechanical signal, appearing before symptoms, biomarker changes, imaging abnormalities, and structural remodelling. This is the prevention window - it responds rapidly and often completely to risk-factor modification, achieving disease reversal with appropriate intervention. Recent CKM publications sharpen the scale of this prevention opportunity: Minhas et al. estimate CKM syndrome affects ~86% of US adults age 45-64, while Mounsey et al. estimate 60-61% of adults meet FDA-approved indications for at least one novel CKM therapy class, representing 148 million US adults and 11.7 million with potential triple-therapy indications
With disease reversal, the IT resolves and Peak VO2 and O2-pulse return to personal optimal levels. Reaching Stage 1 (green) is demanding - every cardiovascular risk factor must be adequately controlled - but those who do can expect optimal quality of life (healthspan) and longevity (lifespan).
Comparative Assessment
Stress Testing Modalities: What Each Provides
The following table compares key cardiovascular risk assessment parameters across stress testing modalities. CPET is the only modality that provides precise functional capacity measurement, early mechanical dysfunction detection, independent prognostic quantification, and individualized exercise prescription data - all without ionizing radiation.
Treadmill Stress Test
No- Functional Capacity
- Estimated METs
- Diagnostic Parameters
- Stress ECG changes
- Mechanical Dysfunction
- No
Stress Echocardiogram
No- Functional Capacity
- Estimated METs
- Diagnostic Parameters
- RWMA + LVEF + Stress ECG
- Mechanical Dysfunction
- Yes
Nuclear (SPECT)
Yes- Functional Capacity
- Estimated METs
- Diagnostic Parameters
- Perfusion defect + Gated SPECT (LVEF/WMA)
- Mechanical Dysfunction
- No
Cardiac PET
Yes- Functional Capacity
- N/A
- Diagnostic Parameters
- Perfusion defect + MBF + MFR
- Mechanical Dysfunction
- No
Cardiac MRI
No- Functional Capacity
- N/A
- Diagnostic Parameters
- Perfusion defect + LGE + LVEF + RWMA
- Mechanical Dysfunction
- Yes
CPET
No- Functional Capacity
- Precisely Measured(Gold Standard)
- Diagnostic Parameters
- Change in O2-pulse & HR Trajectories (IT) + Stress ECG
- Mechanical Dysfunction
- Yes
CPET + ECG Combined Sensitivity
- Sensitivity = 76% when CPET alone is used, at a Peak VO2 cut-off of 72% predicted, for FFR-defined relevant CAD (FFR <0.8)
- Sensitivity = 94% when CPET is combined with abnormal stress ECG - the highest reported combined sensitivity in the literature (Hanke et al. Eur Heart J 2025, n=106)
The CPET Advantage: Beyond the Ischemic Threshold
- Enhanced Sensitivity: CPET reveals stress-induced mechanical dysfunction early in the ischemic cascade, with 4× greater sensitivity than stress ECG (Chaudhry et al. Int J Cardiol 2017;228:114–121). Combined with the higher specificity of stress ECG for MVD, CPET supports improved interpretive accuracy for clinician review
- Clinical Utility: CPET captures in real time the heart rate, work rate, and exact moment cardiac dysfunction begins during exercise (HR@IT). This converts a binary diagnosis into a quantitative threshold - guiding individualized exercise prescription, making cardiac rehabilitation more effective, and giving patients heart-rate ceilings they can monitor with wearable devices to safely calibrate everyday activities
Safety
Completely non-invasive; eliminates risks from ionizing radiation (SPECT/PET) and intravenous contrast agents (MRI/Echo)
Exercise Prescription
Provides a precise, individualized ExRx based on the patient's anaerobic threshold and Inducible Threshold - not possible from any other modality
Longitudinal Tracking
Allows objective tracking of disease progression or therapeutic response through serial assessments. The first test establishes a baseline; subsequent tests define the healthcare trajectory
The Underdiagnosed Epidemic
Microvascular Dysfunction: What Imaging Studies Miss
Microvascular dysfunction (MVD) is structural and functional impairment of the coronary arterioles below the resolution of coronary angiography. MVD involves both endothelium-dependent and -independent mechanisms. It is routinely missed by standard cardiac workup. Patients reach the end of a conventional evaluation with “normal” results and unexplained symptoms
MVD Prevalence: Far More Common Than Recognized
had subclinical cardiac dysfunction despite normal CRF (Smith et al. 2022, n=967)
had early O2-pulse flattening - a marker of subclinical cardiac dysfunction (de Almeida 2022, n=824)
had MVD by invasive AccuIMR, with significantly worse CPET results across every parameter (Li 2024, n=418)
In the CPET-Insight framework, MVD is supported physiologically for clinician review: the combination of an Inducible Threshold (IT) + ST-segment depression on the exercise ECG is treated as a high-specificity pattern consistent with MVD-related ischemia - even when every anatomy-based test is normal
Two Independent Validation Channels
Invasive Validation of CPET-Derived MVD Patterns
The Li et al. 2024 study (Scientific Reports, Nature portfolio; n=418 STEMI post-PCI) established the direct link between invasively measured microvascular resistance and CPET-derived cardiac dysfunction patterns. AccuIMR was the independent predictor of reduced Peak VO2 (OR 1.045, P<0.001), elevated VE/VCO2 slope (OR 1.024, P<0.001), positive ECG (OR 1.033, P=0.007), and early O2-pulse flattening (OR 1.067, P<0.001). These CPET findings support recognition of MVD physiology that is invisible to standard post-PCI assessment
Stress ECG is 100% Specific for MVD
Sinha et al. (JACC 2024, n=102) demonstrated that exercise-induced ST changes were 100% specific for coronary microvascular dysfunction when using the gold standard of combined endothelium-independent CFR and endothelium-dependent AChFR. The traditional “false-positive” rate of exercise stress testing fell to zero when CMD replaced obstructive anatomy as the reference standard
A Third Channel: Asymptomatic Master Athletes Confirm the Same Pattern
Van de Sande 2019: ST Depression Is Real Disease, Not a False Positive
Van de Sande et al. (Med Sci Sports Exerc 2019;51:12–18) screened 753 male master athletes; 102 (13.6%) had abnormal stress ECG with ST depression. Standard imaging - MPS, CCTA, and coronary angiography - ruled out obstructive CAD in 100% of those evaluated. By traditional criteria, every abnormal stress ECG was a “false positive.” CPET disagreed:
Abnormal Stress ECG (n=78)
IT present on CPET: attenuated O2-pulse slope after AT, accelerated ΔHR/ΔWR ratio
- Peak VO2: 42.7 mL/kg/min
- Peak O2-pulse: 20.7 mL/min
Normal Stress ECG (n=78, matched)
No IT signature on CPET
- Peak VO2: 46.7 mL/kg/min (P=0.004)
- Peak O2-pulse: 22.5 mL/min (P=0.004)
The cohort with an IT on CPET had measurably lower peak stroke volume (O2-pulse) and aerobic capacity than the cohort without. The authors concluded that the IT is detecting real mechanical dysfunction on CPET, and the ST depressions on stress ECG are not false positives - they are the electrical fingerprint of microvascular ischemia in fit, asymptomatic individuals
The Women’s Heart Disease Gap
In women, cardiovascular disease causes 1 in 3 deaths, and heart disease in this population is frequently driven by microvascular dysfunction - a small-vessel process that leaves coronary anatomy looking normal despite cardiac symptoms. MVD is the primary driver of heart failure with preserved ejection fraction (HFpEF), which is now the most common type of heart failure. Standard structural workups come back unremarkable. The disease is physiologic:
Bechsgaard et al. 2019 (n=126)
Women with CMD had severely reduced Peak VO2 compared with controls with normal microvascular function: 17.3 vs 27.3 mL/kg/min (P<0.001)
The IT is often the only objective physiologic abnormality in symptomatic women with MVD-driven heart disease. Prognostically, annual CPET gives these patients a measurable target - preserve or improve baseline Peak VO2 through clinician-directed IT-anchored Zone 2 exercise planning and appropriate medical therapy. Serial testing enables close monitoring of progression and regression of disease burden
Guiding Revascularization Strategy
Why IT Matters: O2-pulse Plateau
The O2-pulse is a function of stroke volume (SV) and peripheral oxygen extraction during exercise. The trajectory of the O2-pulse is a clear surrogate reflection of SV response in real time, and an abrupt plateau in mid-exercise (early plateau) is a strong indicator of mechanical dysfunction onset - it is the only CPET parameter shown in a randomized controlled trial to predict which patients benefit from coronary revascularization.
Schematic only - not to scale. In the ischemic response, O2-pulse plateaus within ~90 seconds of AT --> early plateau on treadmill CPET
ORBITA Trial: The PCI Gatekeeper Evidence
The ORBITA trial CPET substudy (Ganesananthan et al. Eur Heart J 2022; n=195 patients with severe single-vessel CAD ≥70% stenosis, randomized 1:1 to PCI vs placebo) provides the strongest evidence for O2-pulse plateau as a PCI decision tool:
- 74% prevalence of O2-pulse plateau by automated analysis
- Plateau predicted higher DSE ischemia scores (+0.82 segments; P=0.007) and lower FFR (−0.07; P=0.011)
- Only O2-pulse plateau predicted placebo-controlled PCI benefit in DSE ischemia (Pinteraction=0.026) and angina limitation (Pinteraction=0.037)
- Other parameters (peak VO2, VE/VCO2, OUES) related to symptom severity but did not predict who would benefit from PCI
Editorial conclusion (Spirito et al. EHJ 2022): CPET may be an appropriate gatekeeper for PCI in chronic coronary syndrome - using the O2-pulse plateau to select patients most likely to derive symptomatic benefit from revascularization.
Distinguishing Ischemic from Physiological Plateau (see Diagnostic Parameters section)
In untrained individuals, it can be normal for stroke volume to plateau after mid-exercise - a physiological finding. The ischemic plateau is distinguishable by three features:
Timing: a physiological plateau is generally gradual and occurs well after the AT, without a decreasing trend; an ischemic plateau is abrupt, occurs earlier in exercise shortly after the AT, and may progressively worsen with a decreasing trend in late exercise
HR acceleration: is not seen in mid-exercise with a physiological plateau; an ischemic response shows an abrupt uptick in ΔHR-WR slope in mid-exercise as autonomic up-regulation attempts to correct for mechanical dysfunction
Double-slope sign: ΔVO2/ΔWR abruptly flattens in a second, lower slope past the AT, concurrent with O2-pulse plateau (Belardinelli et al., 2003). This phenomenon is more pronounced when HR compensatory response is inadequate
O2-Pulse Slope Ratio: Quantifying Severity
Geng et al. (IJC Heart & Vasc 2024, n=138) introduced a continuous quantitative metric: the ratio of the O2-pulse slope in the last 2 minutes of exercise to the slope for the remainder of exercise. An optimal cut-off of 0.4 predicts functionally significant stenosis (AUC 0.632, Sp 77.3%, NPV 86.7%). This converts the binary “plateau/no-plateau” classification into a continuous severity score, enabling serial tracking of therapeutic response
CPET + Coronary CT Angiography (CCTA) = Holistic CAD Assessment
CPET
(Symptoms or Peak VO2 <75%) + IT
CCTA
Define Coronary Anatomy +/- Fractional Flow Reserve (FFR)
Obstructive CAD pathway
Normal or non-obstructive CAD pathway
Complementary Risk Stratification
Coronary Artery Calcium (CAC) + CPETAnatomy Meets Physiology
- Coronary artery calcification is a relatively late-stage marker of atherosclerosis and represents stabilization or healing of soft plaque in the large vessels (macrovascular disease)
- CAC scoring quantifies the anatomic extent of coronary atherosclerosis
- CPET becomes abnormal earlier, when cardiovascular risk factors produce endothelial dysfunction (ED)
- If ED is not reversed, global ischemic burden from microvascular and macrovascular disease accumulates over time, producing progressive decline in Peak VO2, Peak O2-pulse, anaerobic threshold (AT), and pulmonary-circulation efficiency as heart disease advances
- CAC and CPET capture different dimensions of risk; each independently predicts outcomes, and the combination is more effective than either alone for precise, personalized cardiovascular risk assessment
| Comparison | CAC Score | CPET (Peak VO2 + IT) |
|---|---|---|
| Core question | “How much plaque has accumulated?” | Where an individual sits on the heart disease spectrum (Stages 1-4)? This is the feedback patients get from CPET-Insight, not generic CPET studies |
| Assessment type | Static, anatomical assessment | Dynamic, physiological assessment |
| Time scale | Changes slowly (3-7 year re-screening) | Changes are detectable in as little as 3 months |
| Treatment tracking | Score rises with disease progression and plaque stabilization; regression is difficult to track | Tracks progression and regression in linear manner |
| Microvascular disease (MVD) | Cannot detect soft plaque or MVD | Directly detects MVD (IT + ST depression) |
Fitness Modifies CAC Risk
Radford et al. (Circulation 2018; n=8,425 men; 8.4-year follow-up) established that each 1-MET higher CRF was associated with 11% lower CVD events - and this benefit held at every CAC level, with no statistically significant interaction (P=0.69). Patients with high CAC have the most to gain in absolute risk reduction from fitness improvement
CAC = 0 Does Not Exclude MVD
Patel et al. (Circ Cardiovasc Imaging 2022; n=5,983) found that 37.8% of symptomatic patients with a CAC score of zero had impaired myocardial blood flow reserve, independently associated with higher mortality. Zero calcium score argues against calcified plaque but does not exclude microvascular dysfunction
CRF Predicts Plaque Composition
Fossdal et al. (EHJ 2024, n=699) showed higher Peak VO2 inversely associated with total plaque burden (β=−0.179, P<0.001) and specifically with high-risk plaque subtypes (necrotic core, fibrous-fatty) most associated with rupture and acute coronary syndrome
Women: Risk at Lower Plaque Burden
PROMISE CCTA analysis (Circulation: Cardiovascular Imaging 2026; n=4,267) found plaque was less frequent in women than men (55% vs 75%), with lower total plaque volume, yet MACE rates were similar (2.3% vs 3.4%). Women’s risk emerged at lower plaque burden, supporting functional assessment alongside anatomy-based imaging
Published Evidence Base
Key References: 19 Anchor Studies
The four Chaudhry foundational papers established the methodology; the remaining fifteen represent the most cited external validation, diagnostic accuracy, microvascular, prognostic, and CKM-prevention studies that support the page’s clinical claims.
| Study | n | Focus | Key Finding |
|---|---|---|---|
Chaudhry et al. Am J Cardiol 2009 | - | Chaudhry Framework | Concept paper defining the Inducible Threshold on CPET: O2-pulse plateau + ΔVO2/ΔWR flattening + HR acceleration after the AT |
Chaudhry et al. Mayo Clin Proc 2010 | 1 (longitudinal) | Chaudhry Framework | First longitudinal proof: subclinical dysfunction detected via IT, progressed untreated, then reversed with lipid-lowering therapy (Peak VO2 70% → 80% predicted) |
Chaudhry et al. Int J Cardiol 2017 | 208 | Chaudhry Framework | Prospective angiogram validation of ΔHR-WR slope. Sensitivity 60% → 94% over stress ECG alone (men). No obstructive/non-obstructive difference - detects MVD |
Chaudhry et al. Curr Opin Cardiol 2023 | 30 studies | Chaudhry Framework | State-of-the-art review: compiled 2003–2022 evidence. Introduced four-stage IHD spectrum. Formalized CPET as primary evaluation tool for suspected CAD |
Belardinelli et al. Int J Cardiol 2014 | 1,265 | External Validation | CPET sensitivity 88% vs stress ECG 48% (P<0.001). Peak VO2 >91% + no ischemia signs ruled out obstructive CAD in 100% of cases |
Van de Sande et al. Med Sci Sports Exerc 2019 | 156 | External Validation | Male master athletes with abnormal stress ECG had obstructive CAD ruled out by imaging in 100%. CPET still revealed the IT signature and validated the IT criteria established by Chaudhry et al. as consistent with microvascular disease (MVD) and that ST depression in this population is not a “false positive” |
Ganesananthan et al. Eur Heart J 2022 | 195 | External Validation | ORBITA substudy. O2-pulse plateau was the only CPET parameter that predicted placebo-controlled PCI benefit (Pint=0.026). CPET as PCI gatekeeper |
Li et al. J Thorac Dis 2022 | 155 | Diagnostic Accuracy | Combined 7-parameter CPET model: AUC 0.974, sensitivity 86.4%, specificity 98.5% for significant CAD - matches or exceeds non-invasive imaging |
Liu et al. J Clin Med 2022 | 280 | Diagnostic Accuracy | Independent replication of Li 2022: AUC 0.974 for predicting significant CAD. Confirms reproducibility of the combined CPET model |
Hanke et al. Eur Heart J 2025 | 106 | Diagnostic Accuracy | CPET + abnormal stress ECG combined sensitivity 93.6% for FFR-defined relevant CAD - highest reported in the literature. CPET alone sensitivity 76% at a Peak VO2 cut-off of 72% predicted |
Sinha et al. J Am Coll Cardiol 2024 | 102 | MVD / CMD | Exercise-induced ST changes were 100% specific for coronary microvascular dysfunction vs. combined CFR + AChFR gold standard. “False positives” were real CMD |
Bechsgaard et al. Int J Cardiol 2019 | 126 | MVD / CMD | Women with CMD had severely reduced Peak VO2 (17.3 vs 27.3 mL/kg/min, P<0.001). IT often the only diagnostic abnormality in women with MVD |
Li et al. Sci Rep (Nature) 2024 | 418 | MVD / CMD | Post-PCI STEMI: invasive AccuIMR was independent predictor of reduced Peak VO2, elevated VE/VCO2, and early O2-pulse flattening |
Radford et al. Circulation 2018 | 8,425 | CAC + CRF | Each 1-MET higher CRF: 11% lower CVD events at every CAC level (P-interaction=0.69). Fitness benefit independent of plaque burden |
Patel et al. Circ Cardiovasc Imaging 2022 | 5,983 | CAC + CRF | 37.8% of symptomatic patients with CAC=0 had impaired myocardial blood flow reserve. Zero calcium does not exclude microvascular disease |
Niu et al. J Int Med Res 2020 | post-PCI ACS | Severity / Prognosis | Post-PCI CPET predicted MACE with C-statistic 0.92. Four independent predictors including reduced heart rate reserve |
Geng et al. IJC Heart & Vasc 2024 | 138 | Severity / Prognosis | Introduced O2-pulse slope ratio (cut-off 0.4) as continuous severity metric for functionally significant stenosis. Enables serial tracking |
Minhas et al. J Am Coll Cardiol 2024 | NHANES | CKM Prevention | US CKM prevalence estimate: CKM Stage 1-3 present in 85.95% of adults age 45-64, reinforcing primary prevention as the dominant clinical scenario |
Mounsey et al. JAMA Cardiol 2026 | 148M US adults | CKM Prevention | FDA-approved CKM therapy indications were present in 60-61% of adults; 11.7 million US adults had potential indications for GLP-1RA + SGLT2i + nsMRA triple therapy |
A complete citation list spanning 50+ studies is available on request
Submit a Coronary Physiology Case
Receive a mechanism-based CPET interpretation from a physician with 22+ years of IHD expertise and the peer-reviewed framework for coronary artery disease assessment